Stefari Case Study
I have been working with Stefari in a variety of ways since they opened in 2017. During most of this time I have managed the social media accounts - with a few breaks.
Now I personally manage both locations and all marketing and website, design, and website needs. Since 2017 I have helped grow and create a special image behind the brand. From product photography to viral reels, website content and graphic design, and general support throughout the years.
Stefari holds a special place in my heart and it is pure joy to continue to develop our presence in the community and online and now being able to put my own spin and investment into the marketing.
Services Offered
Social Media Marketing - Instagram, Facebook
Facebook Ads
Website Design & Content
Menu Design
Social Graphic Design
Video
Product Photography
Event Planning & Management
Results
Focusing on Stefari Coffee House and the growth during the first year.
Total Facebook Followers: 1,014
Total Instagram Followers: 639
-
November - January vs previous period
7.5% increase in views
7.4% increase in viewers
15.1% increase in content interactions
Total Content Views: 78,055
From followers: 28,591 | From non-followers: 49,464
Organic: 77,549 | Ads: 506
3-Second Views: 9,759 all organic
From followers: 2,844 | From non-followers: 6,915
Total Interactions: 1,612
From followers: 1,270 | From non-followers: 342
August - October vs previous period
77.4% increase in views
3.8% increase in visits
75.3% increase in content interactions
Total Content Views: 66,587
From followers: 23,802 | From non-followers: 40,580
Organic: 59,380 | Ads: 7,207
3-Second Views: 6,000
From followers: 1,279 | From non-followers: 4,721
Total Interactions: 1,313
From followers: 1,029 | From non-followers: 284
-
November - January vs previous period
5.5% increase in views
23.4% increase in reach
26.6% increase in content interactions
Total Reel Views: 21,664
Total Content Views: 97,839
From followers: 57,968 | From non-followers: 39,851
Total Reach: 10,735
From followers: 565 | From non-followers: 10,224
Total Interactions: 2,200
August - October vs previous period
858.8% increase in views
38.6% increase in reach
783.8% increase in content interactions
Total Content Views: 92,731
From followers: 56,066 | From non-followers: 36,652
Total Reach: 8,697
From followers: 517 | From non-followers: 8,232
Total Interactions: 1,800
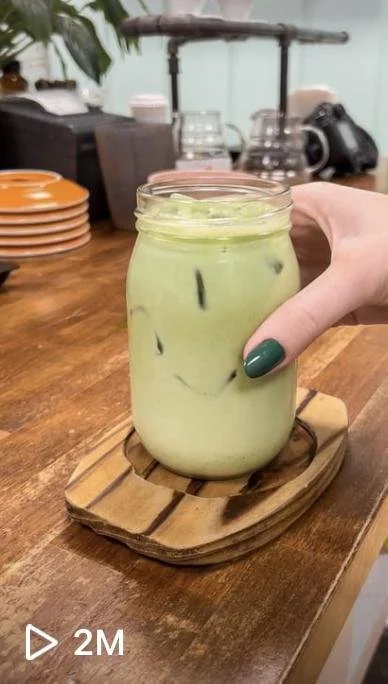
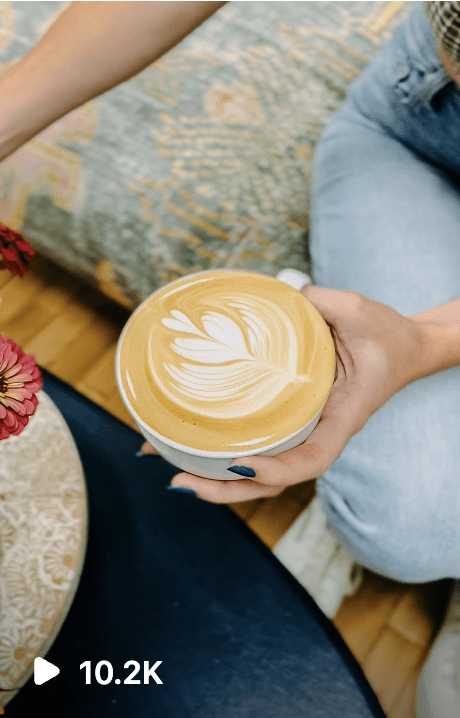
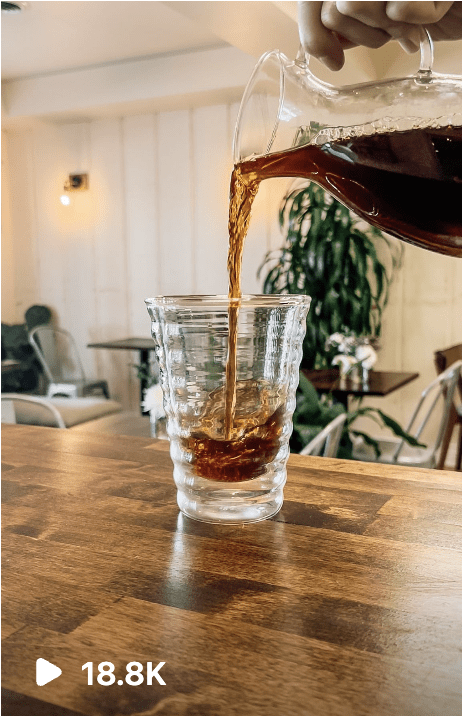
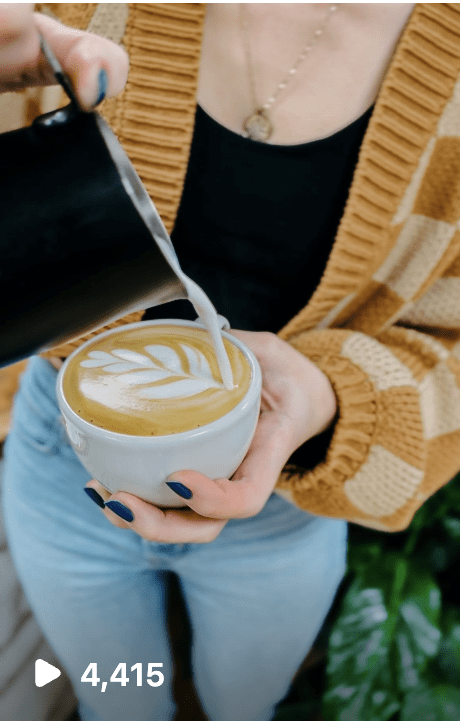
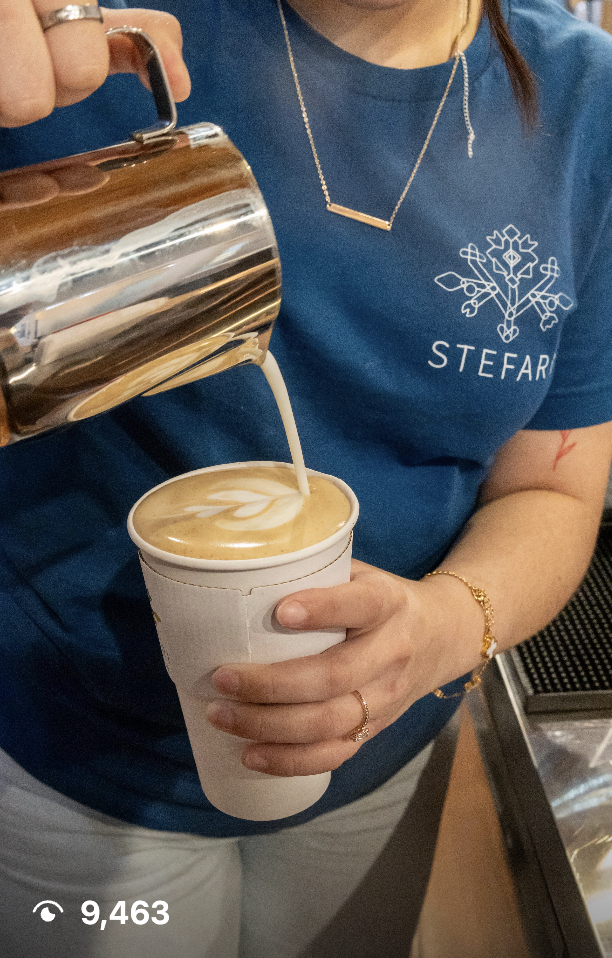
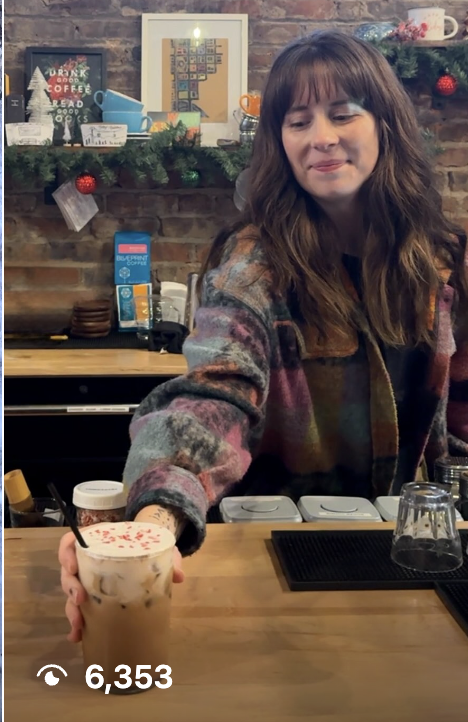
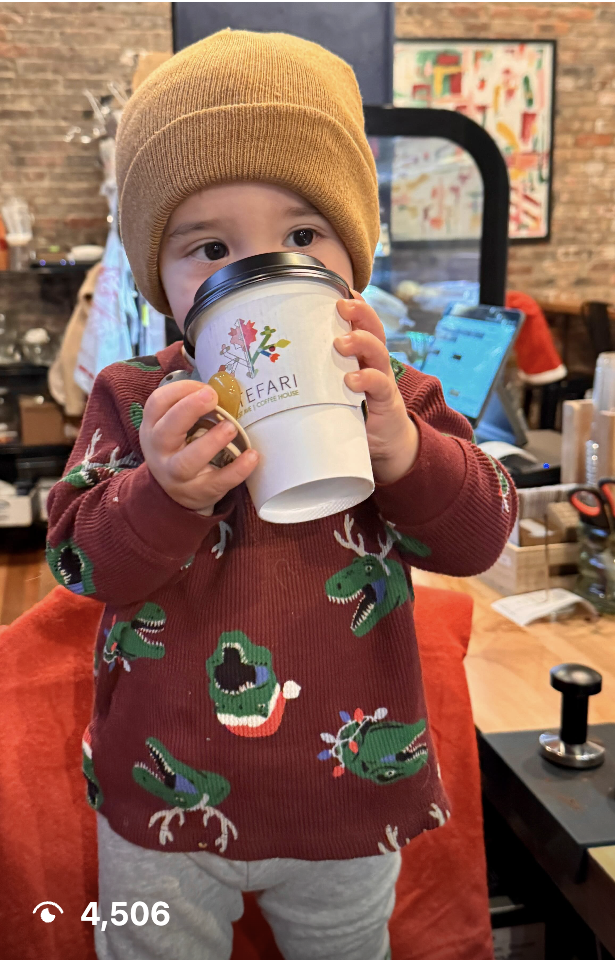
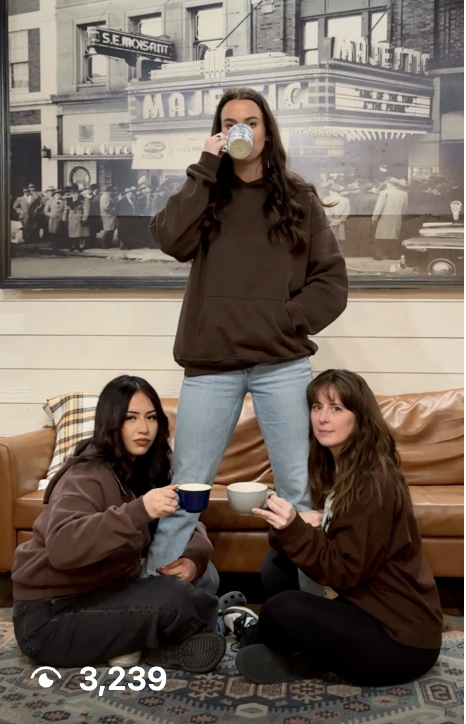
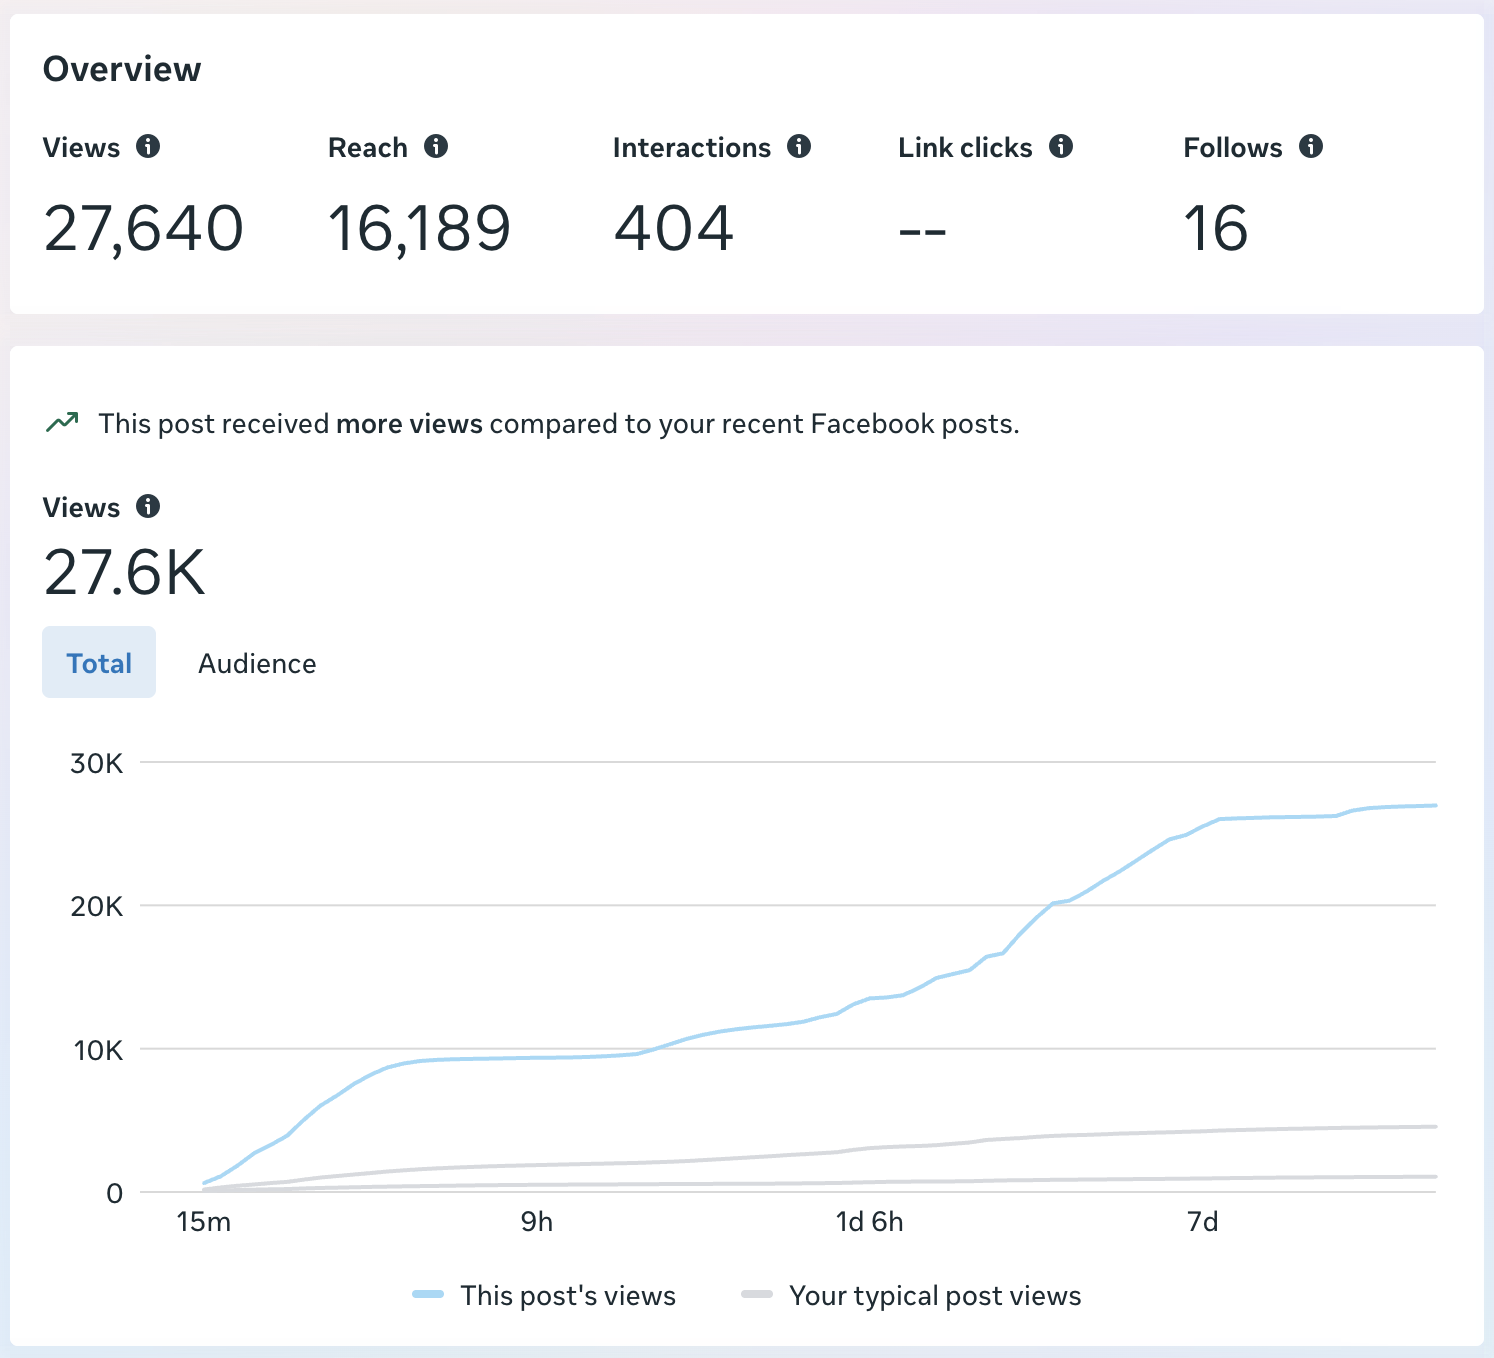
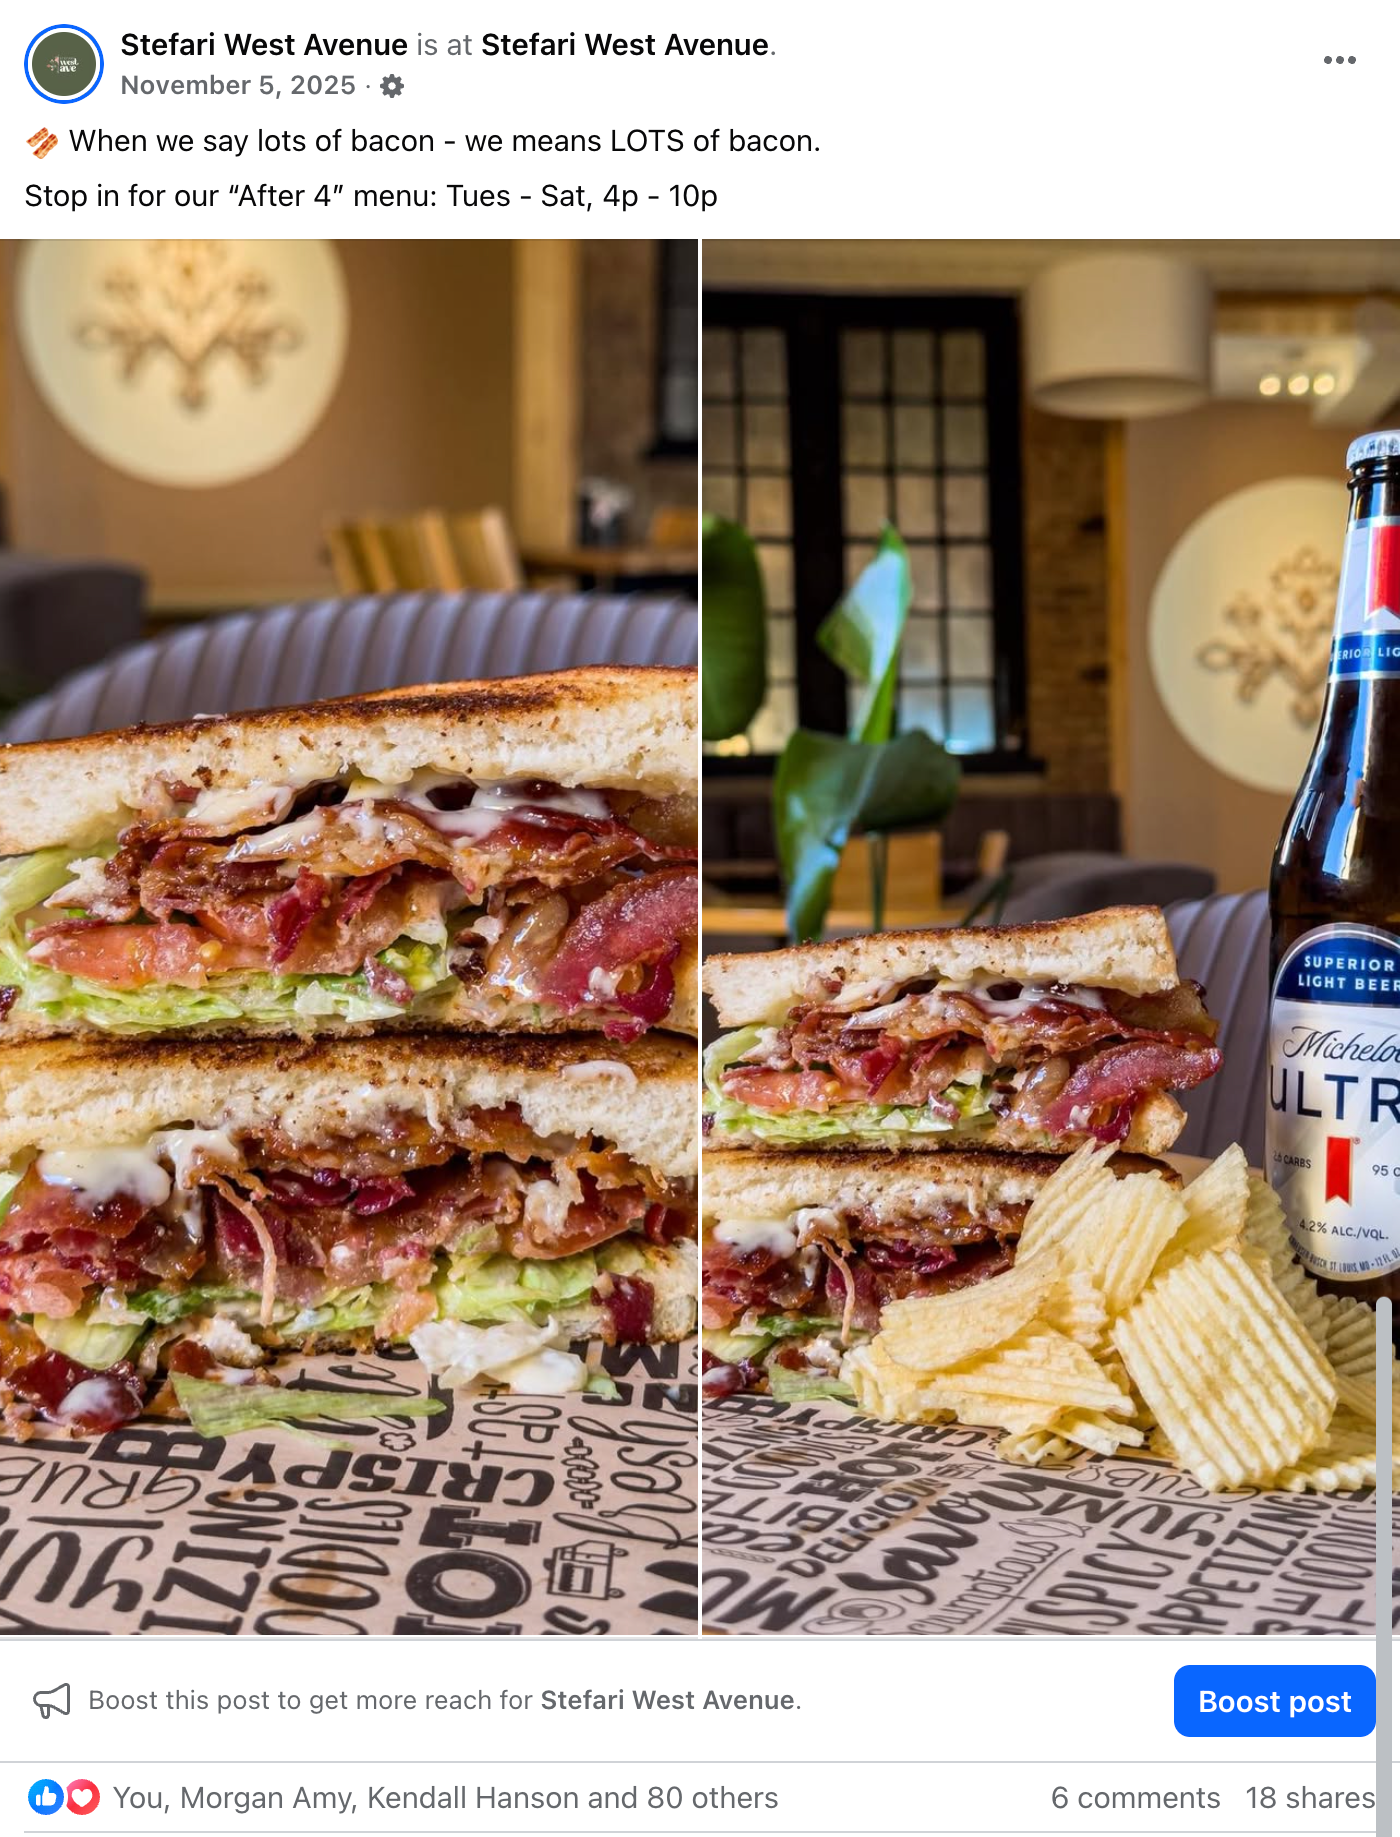
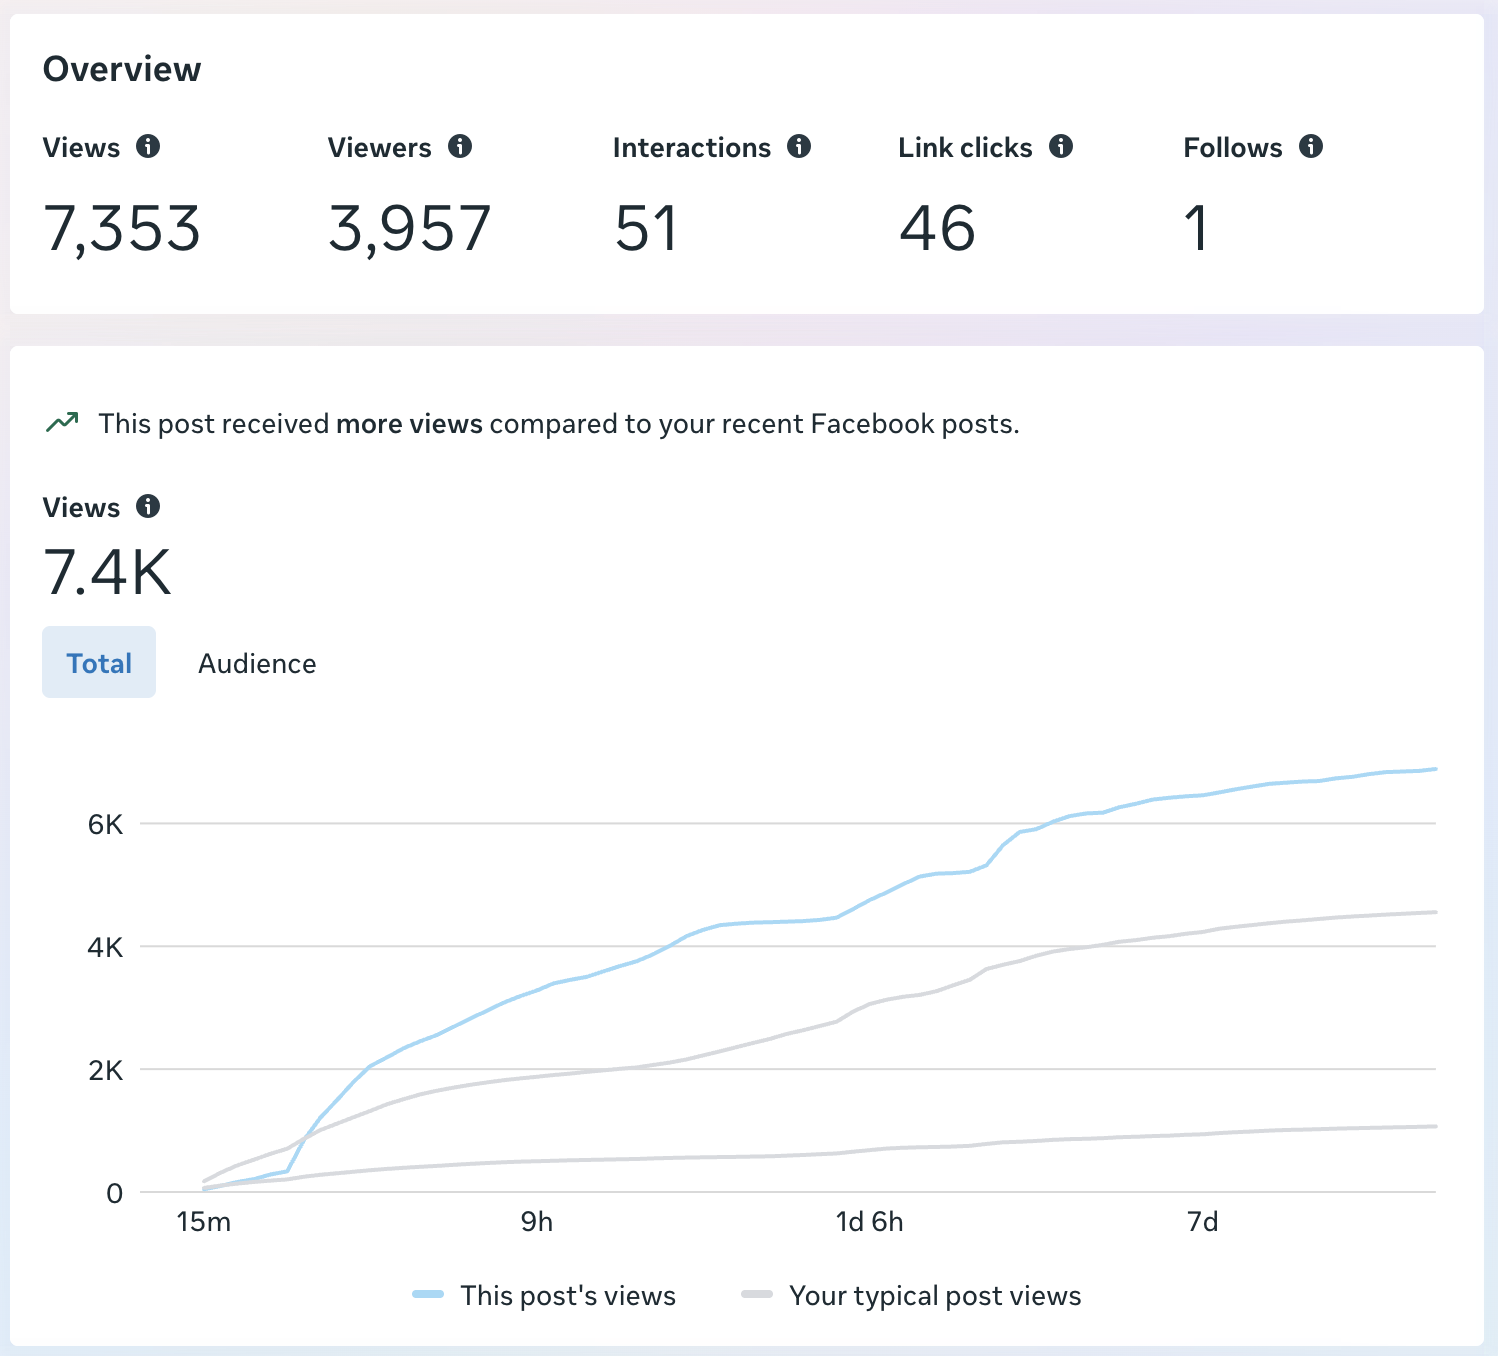
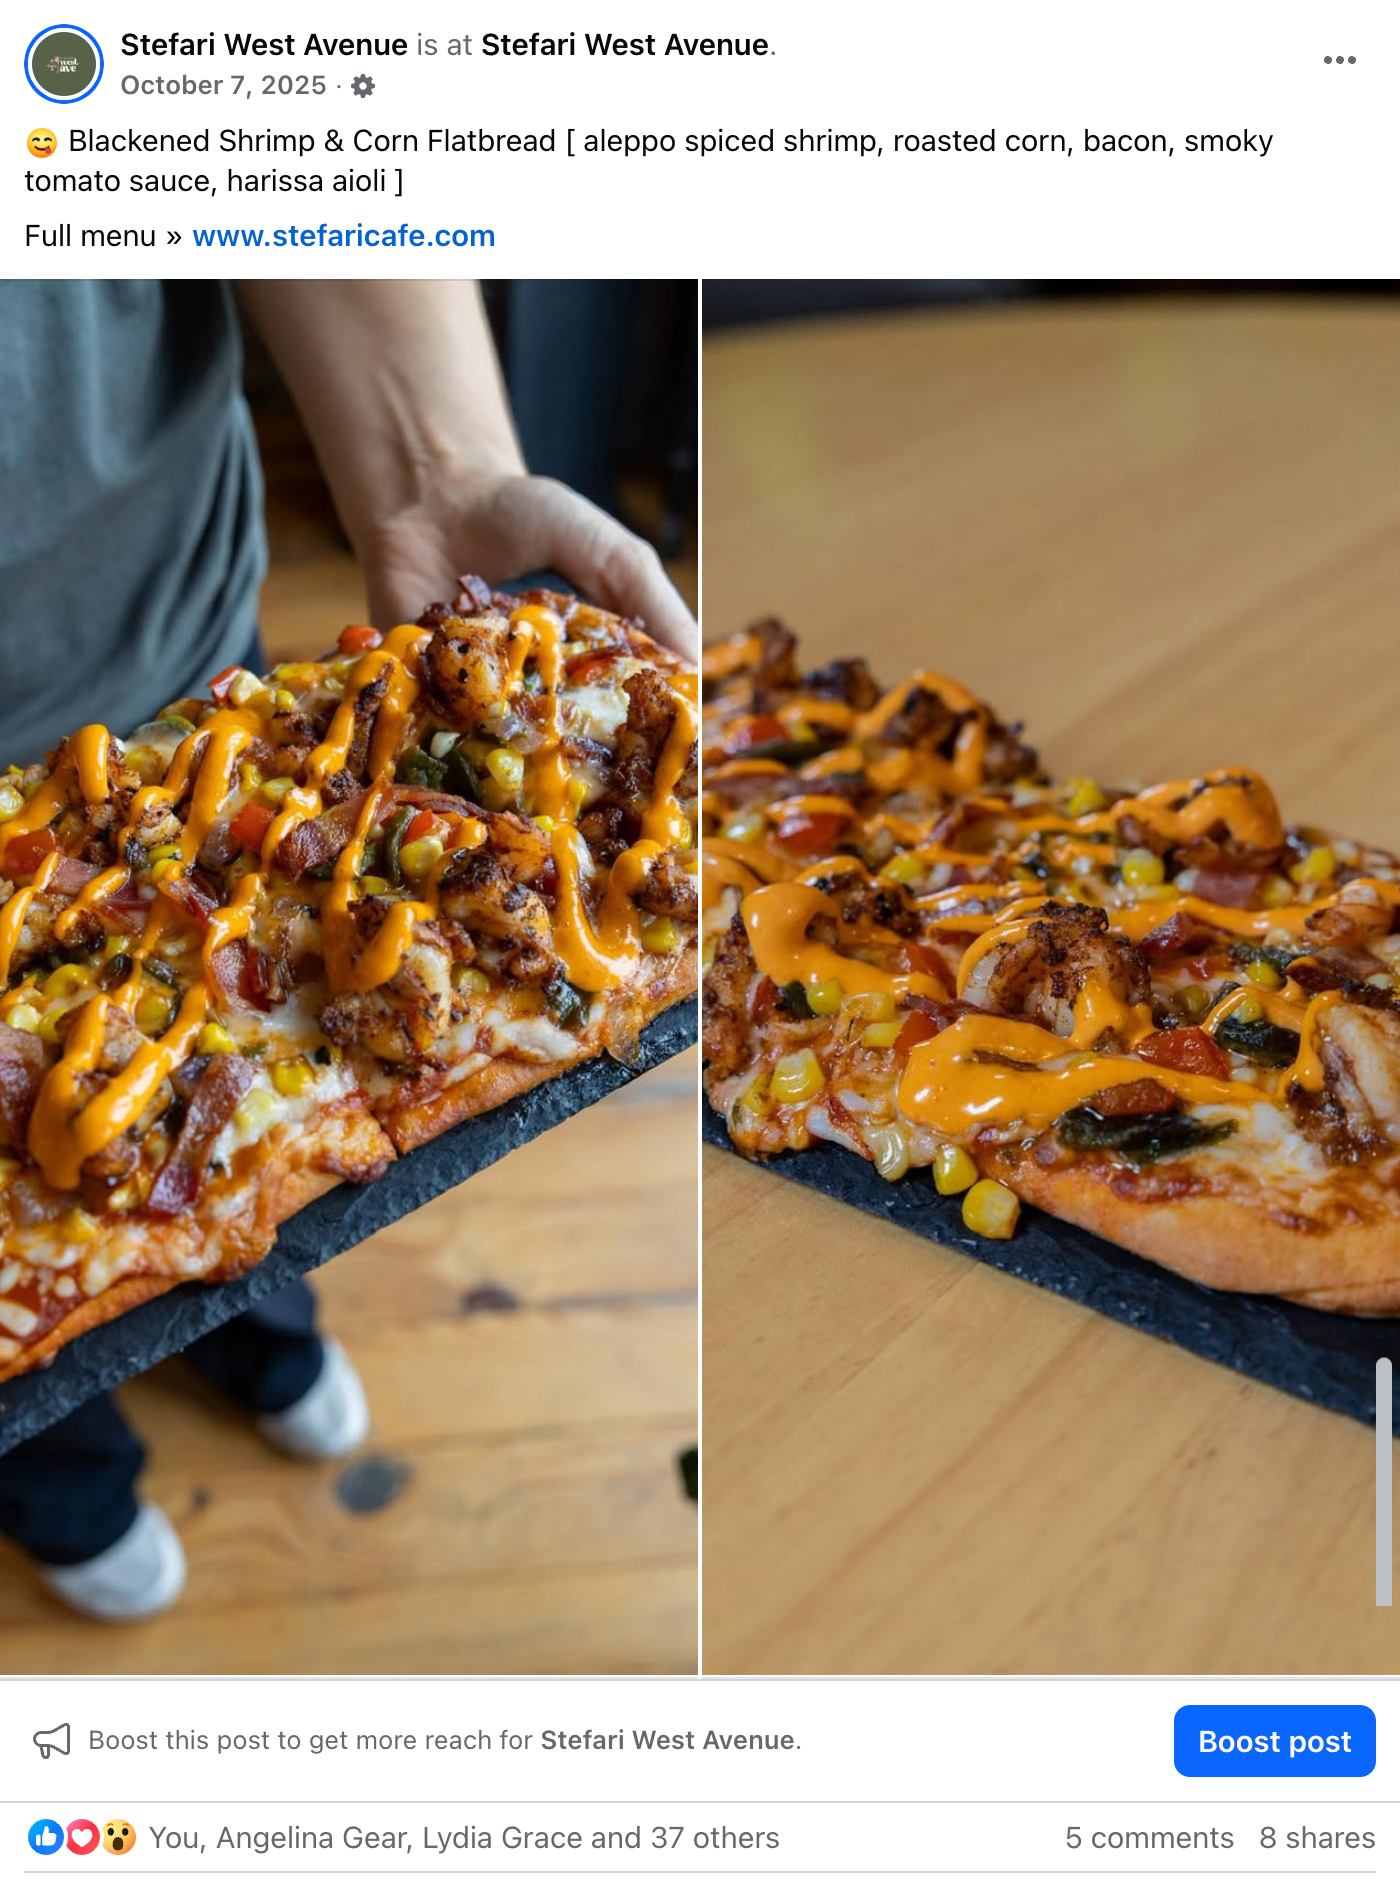
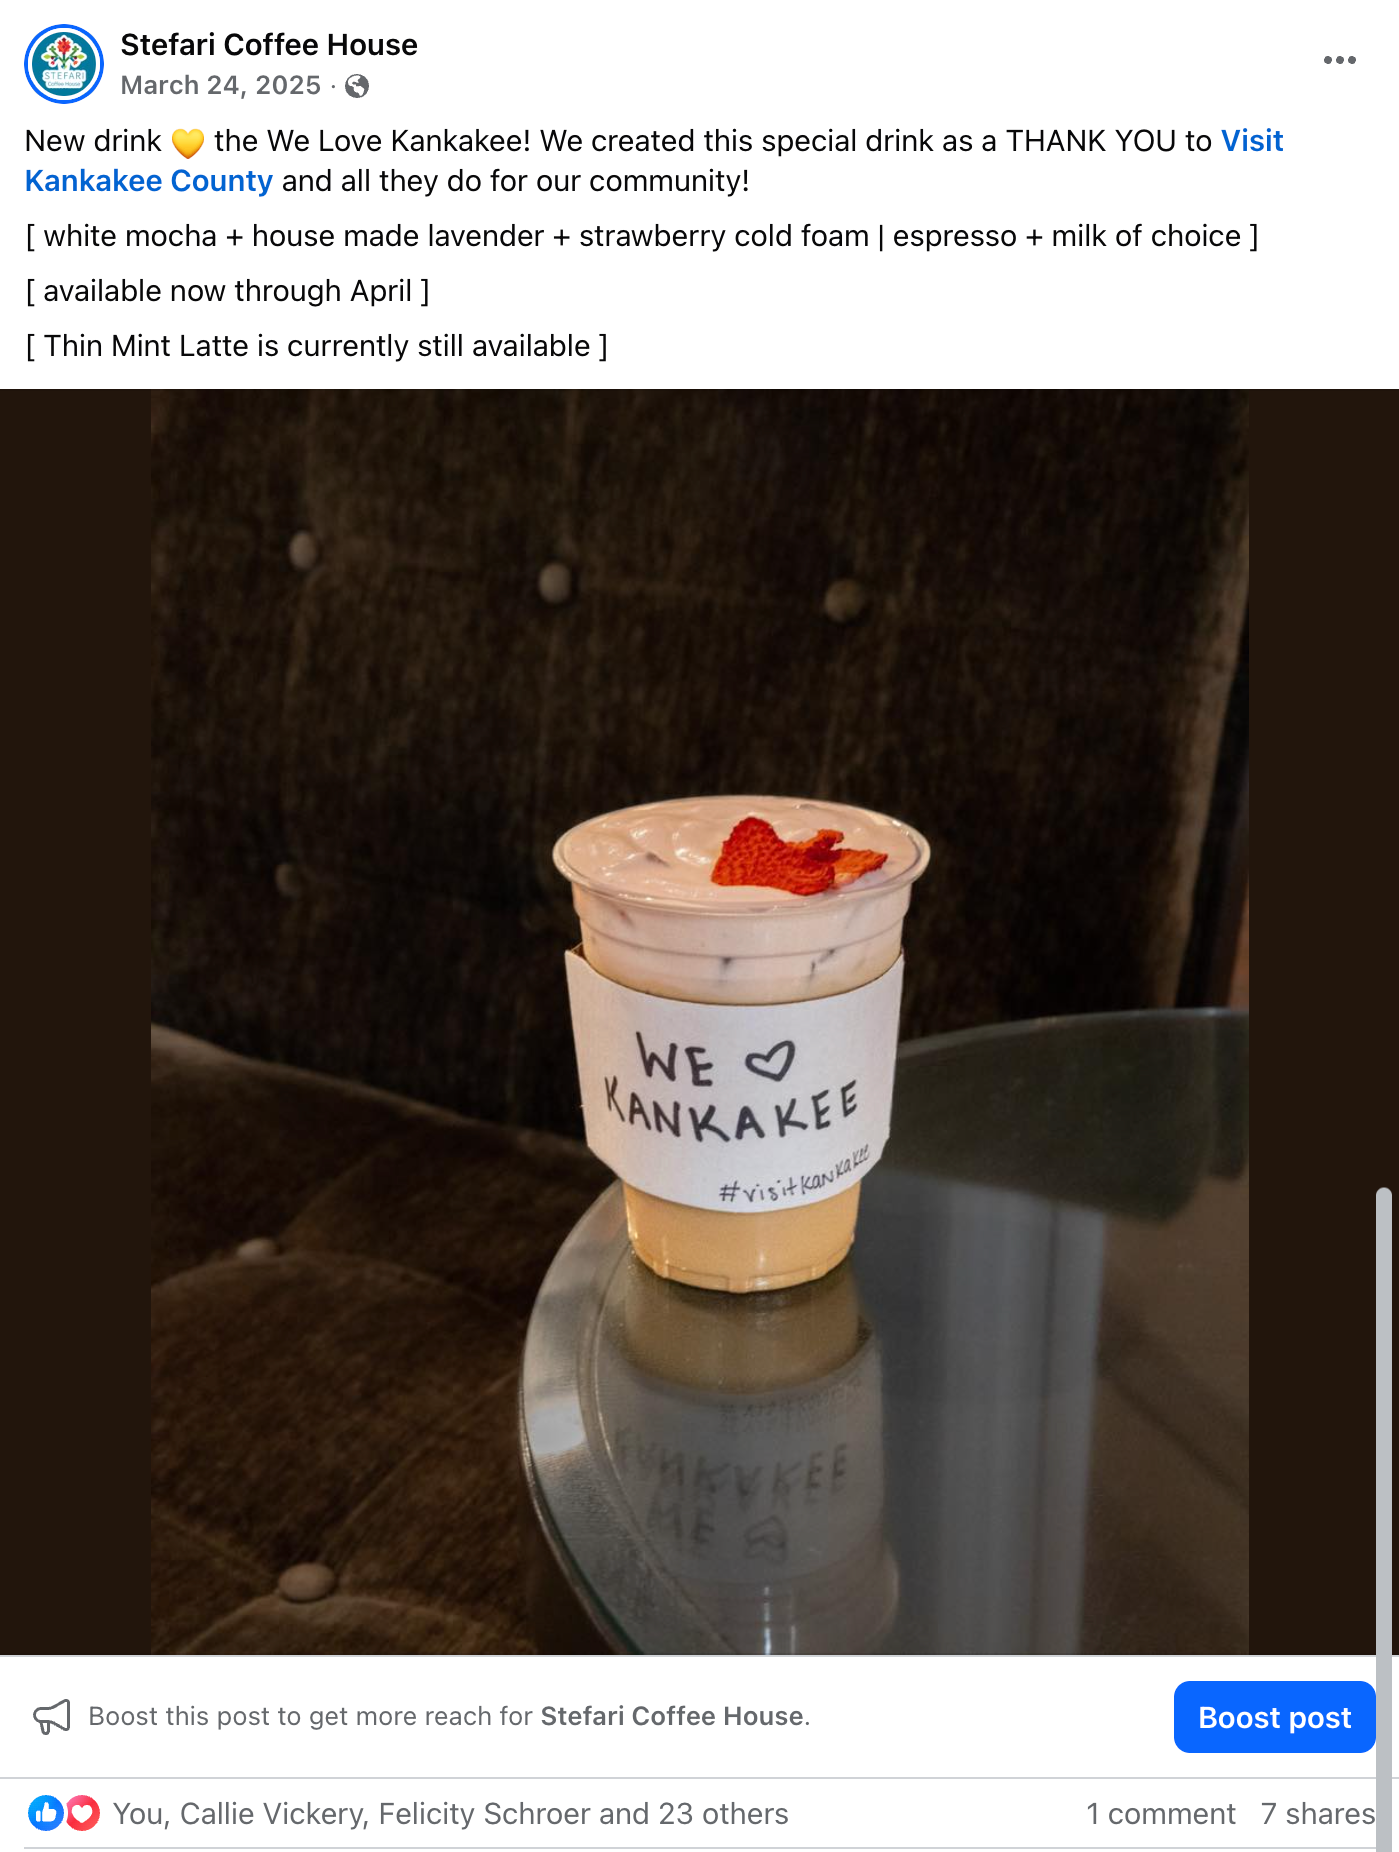
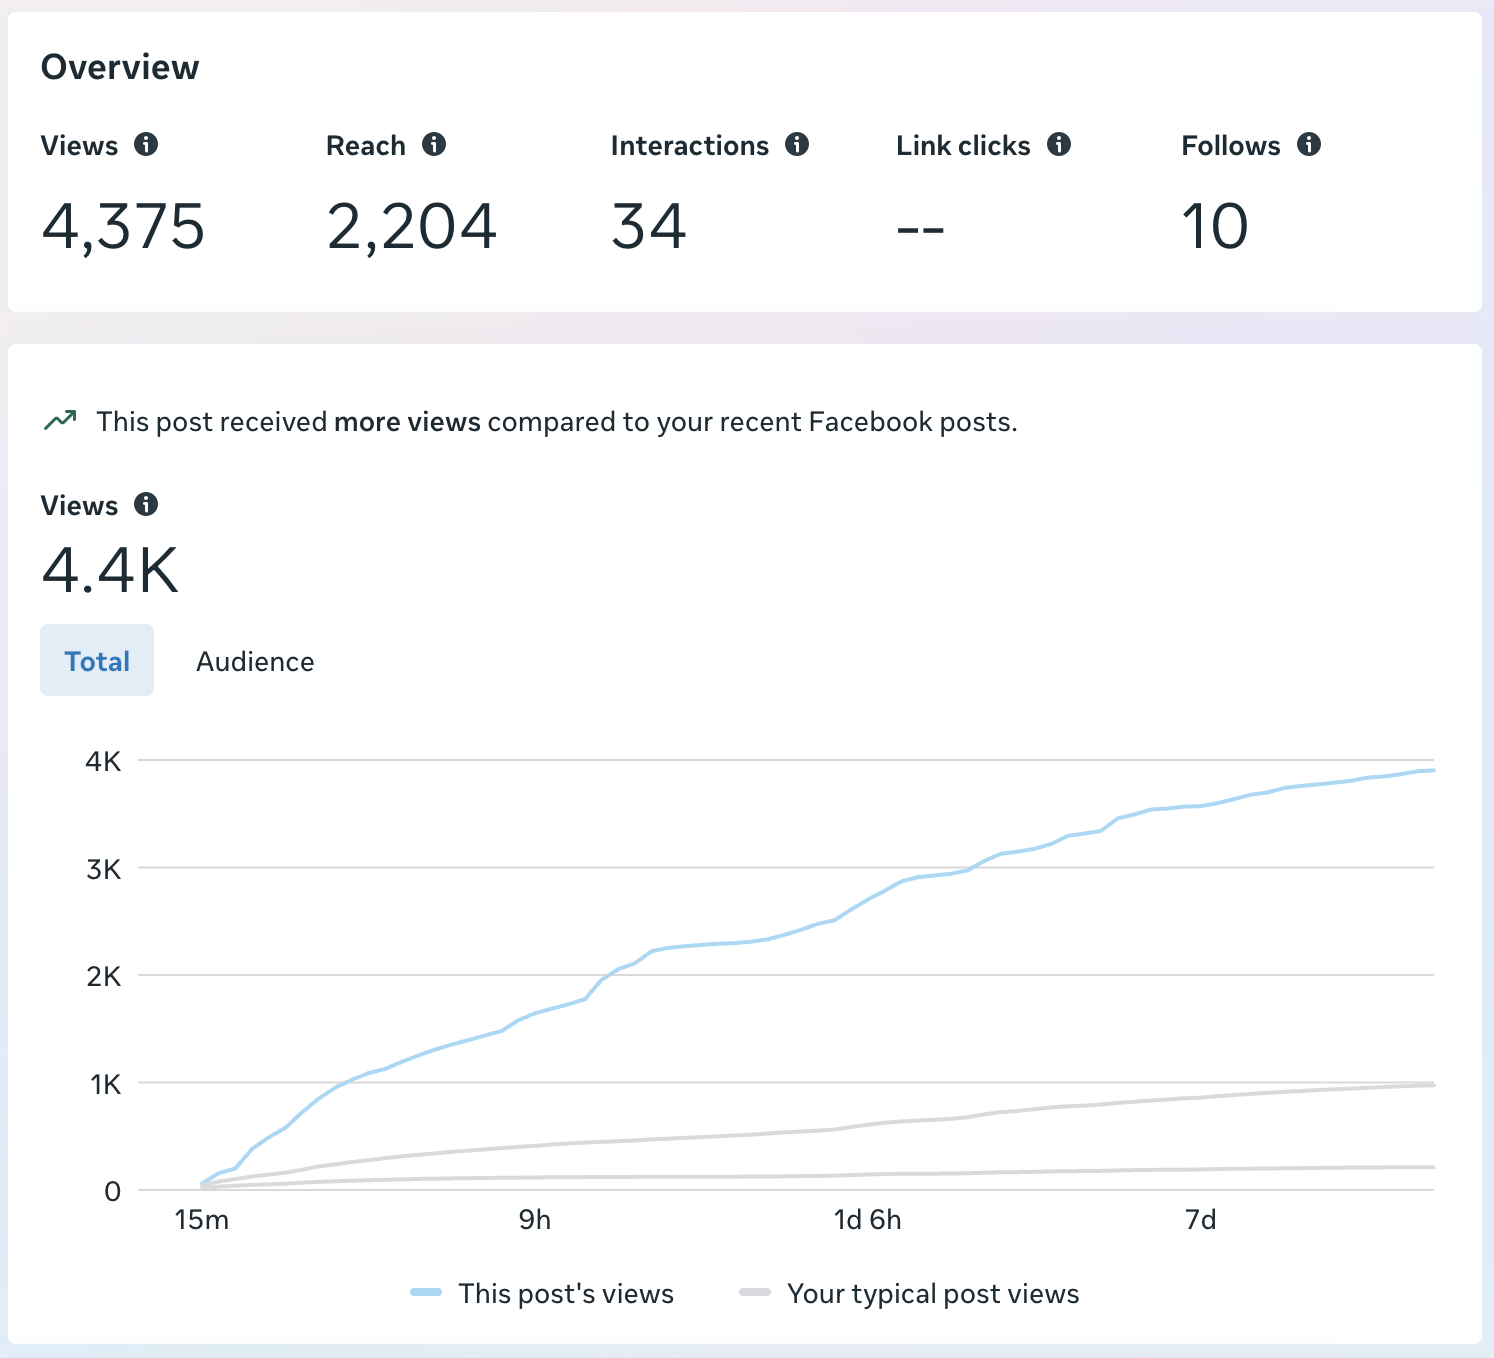
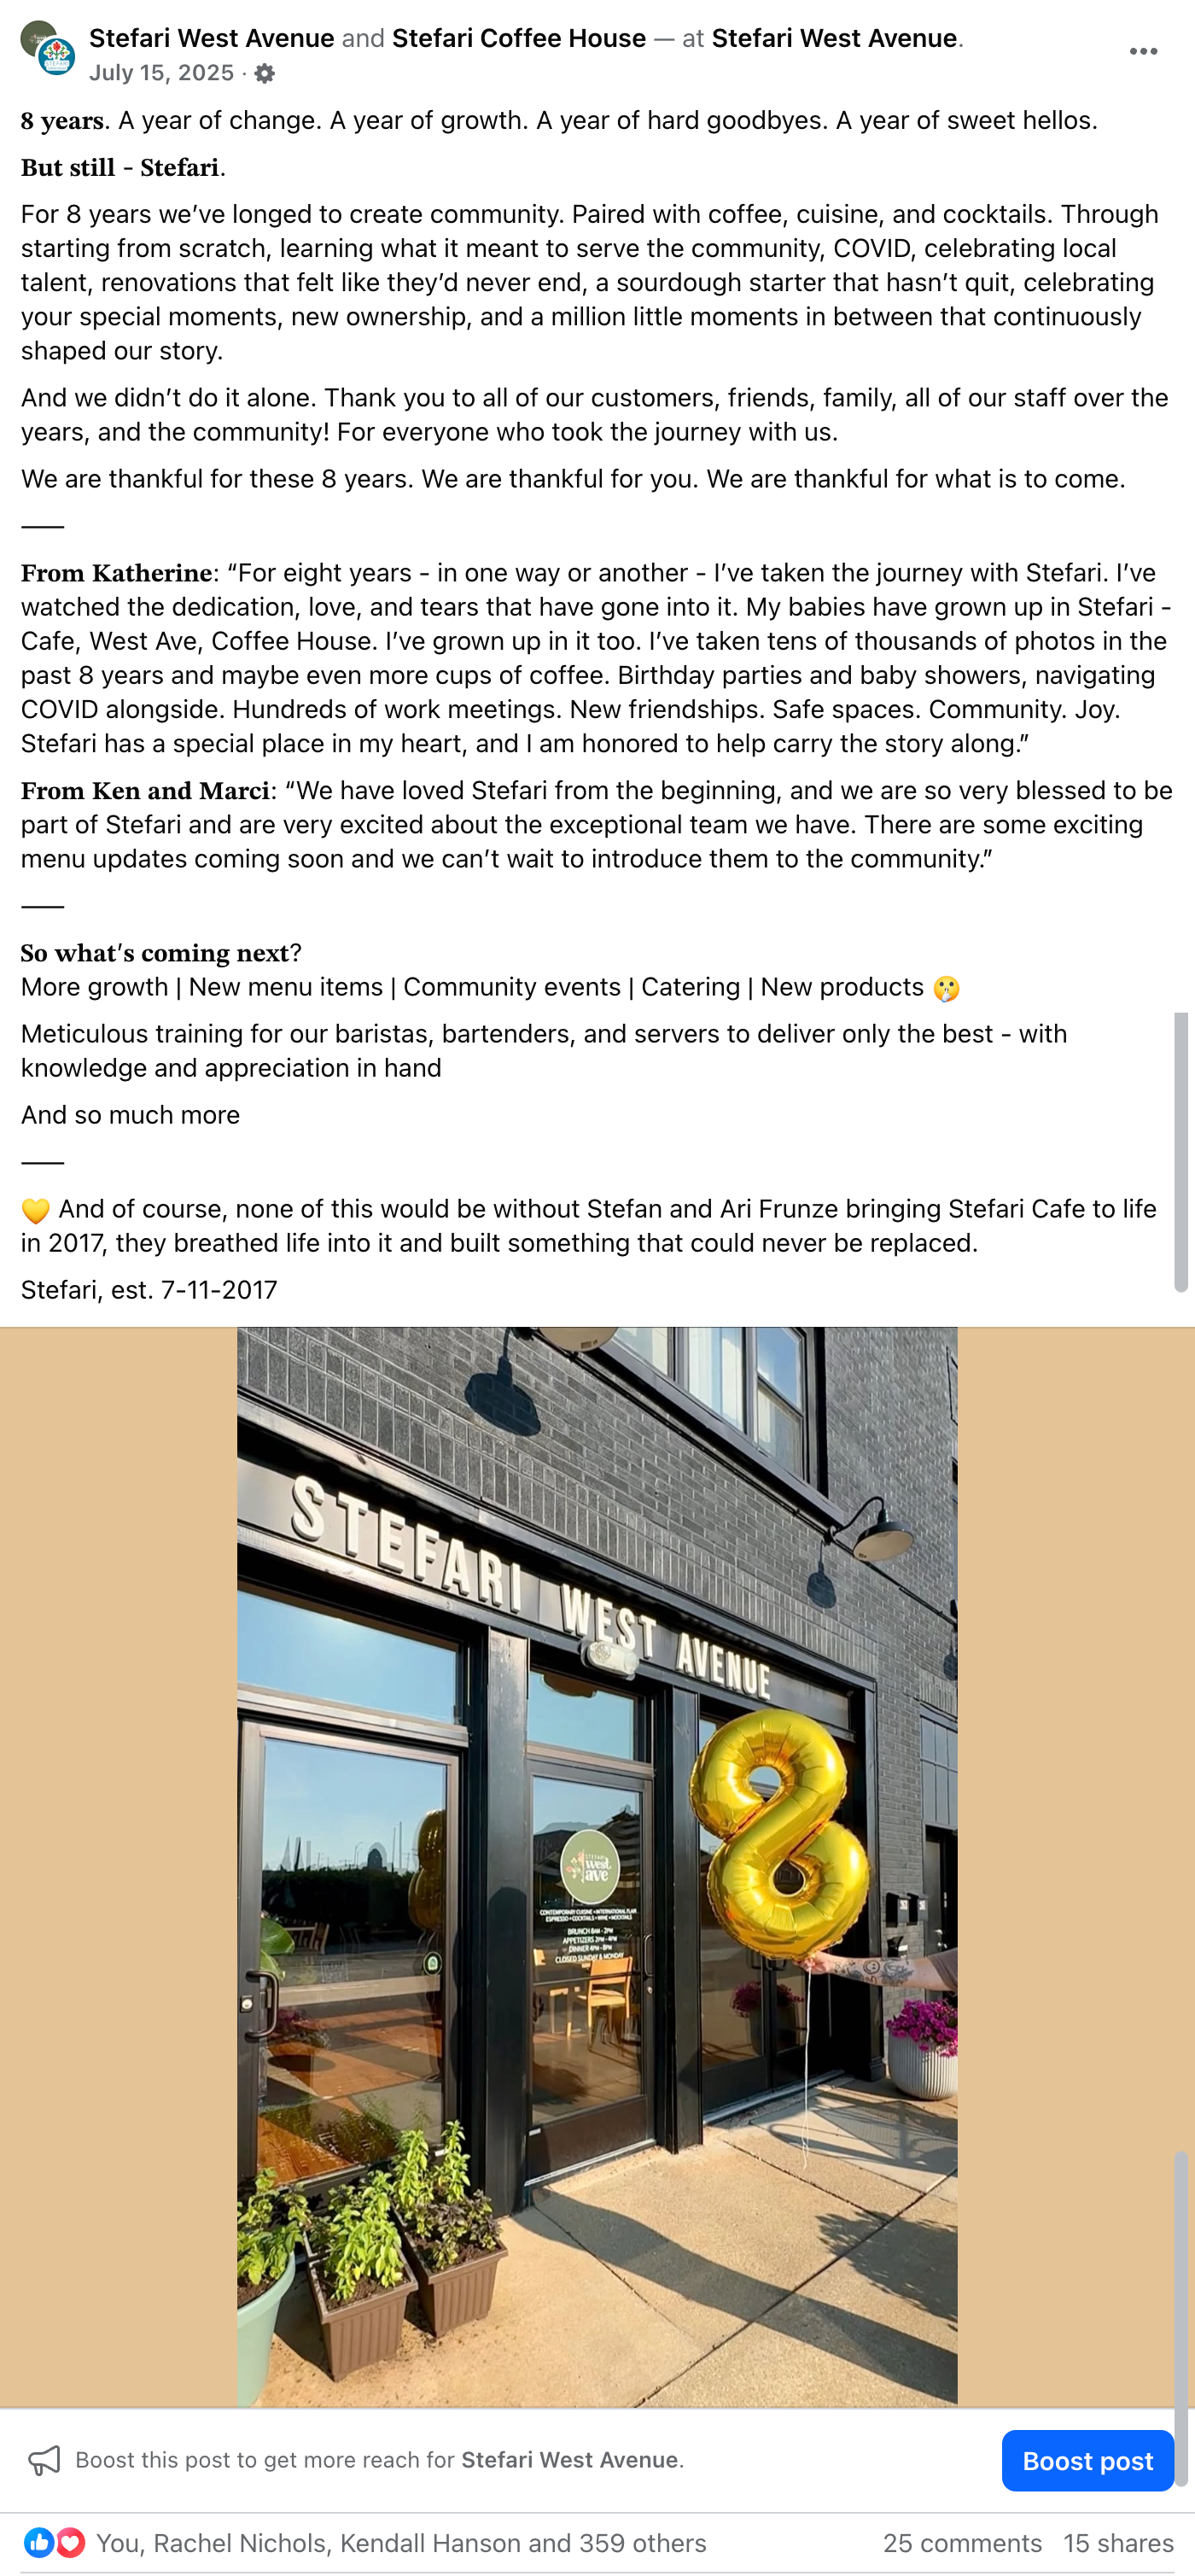
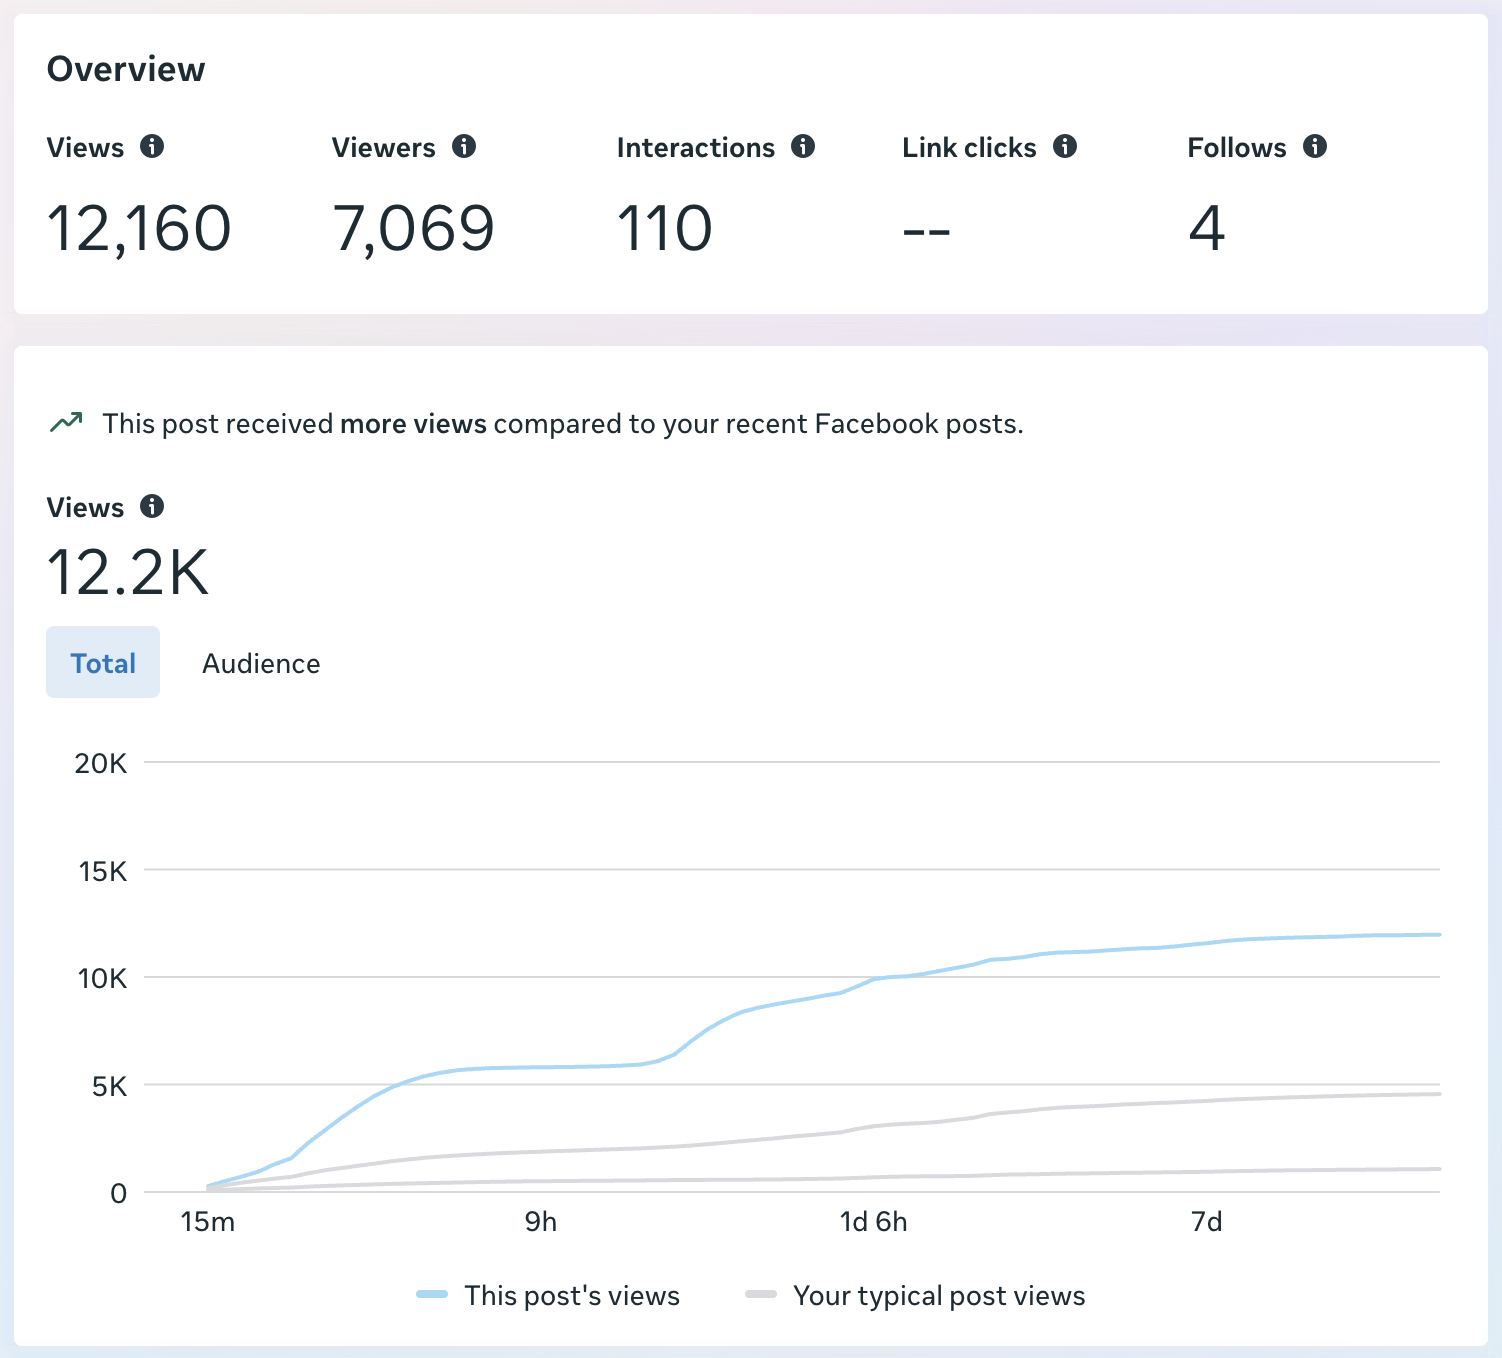
Well Done Content
It’s not always about going viral, but it sure is fun when you do!